What do the indicators mean in VKontakte statistics?
Let's start with the basics (by the way, these are the basics of media planning - if you want to learn more, you know what to Google).
Impressions - The total number of times your post was shown. All views are counted here, that is, one user is “recorded” in this indicator several times.
Reach is a metric that measures the number of people who saw your material. Reach only evaluates unique users. That is, how many people have you reached? We have already written in more detail about coverage in a separate article.
In addition, VKontakte statistics contain information about four types of coverage:
Total coverage is the total number of all users reached (the sum of the three parameters listed below).
Subscriber reach is the number of users who saw the post and are at the same time subscribed to the community.
Viral reach is the number of users who saw the material, although they are not subscribed to the community (for example, they saw a repost on a friend’s page or received a post in personal messages).
Advertising reach - users reached through paid promotion.
How to use statistics to bring your page to the top?
Why are those statistics needed? Without it, it is impossible to see your mistakes and improve the content and quality of the material. Since the information will show which posts are the most popular, which audience is “yours”, when is the best time to publish, at what moments are more subscribed, who views the account more often. By improving each indicator (depending on the topic and the desired final goal), you can get to the TOP of the search engine. And this attracts even more subscribers and advertisers (and therefore you will earn more money).
Plus - almost every advertiser or affiliate program will ask for statistics in order to understand what to expect and whether it is worth doing business with you.
Read about how to use VK group statistics for successful promotion in the corresponding article.
How to view VKontakte community statistics
There are two convenient ways to view page statistics:
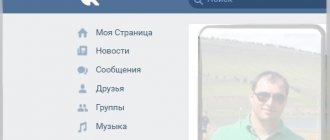
- Built-in VKontakte statistics (your own accounts);
- Using an analytics service on social networks (your own and other people’s pages).
VKontakte pages and groups have the same statistics, so let’s agree - we’ll tell you about everything at once.
The simplest numbers can be obtained directly on the community page: the number of views, likes, comments, reposts of publications, the number of subscribers. This data is visible to all users.
For more detailed statistics, go to the "Community Management - Statistics" section.
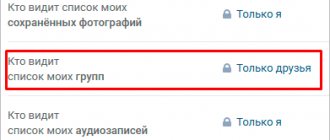
By default, detailed VK statistics are available only to administrators, but they can be opened to everyone. This function is used by public owners who sell advertising: open statistics prove that posting in the community will be effective.
To change access to community statistics, scroll to the bottom of the statistics page, where the “Who can access community statistics” block is located there.
Here you will see sections:
- Coverage;
- Attendance;
- Activity;
- Community messages;
- Records.
The “Reach” and “Attendance” sections contain graphs that can be displayed by day, week or month and select the desired time interval.
Below is information about the audience in question:
- Gender/Age;
- Geography;
- Devices (mobile/computers).
The “Activity” section displays information about user actions:
- Subscribe to notifications about new posts in the community.
- Engagement indicators: Likes; Comments; Reposts; Hiding community posts from the feed;
- Activity in photo albums;
- Participation in discussions.
The “Community Messages” section collects information about correspondence with the page. Even if you don't have the Community Posts widget connected, you can still see information about user requests to yours on your community page.
There are two graphs available here:
- Unique users who sent messages;
- Number of messages sent and received.
Post statistics are available for communities with more than 5,000 members. By default, this data is not collected. When you first enter this section, click on the “Enable advanced statistics” button.
Unlike other statistics sections on VKontakte, detailed post statistics are visible only to administrators and editors, even if in the settings you have opened the statistics to everyone.
The “Posts” section displays data about each community post. On the site you can see statistics about the last 150 publications, and in the download - about 300.
When you delete a post, its statistics also disappear.
In the "Posts" section you will see:
- Total reach and subscriber reach;
- Likes;
- Reposts;
- Comments.
In the hiding tab: Number of times the entry has been hidden. Complaints. Hiding all entries.
In the transitions tab: The number of people who transferred to the community, joined the community and clicked on the link. Number of introductions from this entry. Number of clicks on the link.
Data is updated every 10 minutes.
Group statistics
Where are statistics indicated in a contact? This can be done on the group page if the statistics are open for viewing or by using additional resources. But they also only work with open access. Statistics of communities in contact can be viewed through auxiliary resources:
- socialstats.ru;
- popsters.ru;
- https://vk.com/stats?gid=.
With the help of socialstats.ru, you can view not only contact statistics, but also traffic to photo albums, groups and “walls” of friends on the social network. Through popsters.ru you can get data from groups on any social network. While viewing, you can go to the publication using direct links. The resource allows you to sort data by parameters:
- popularity of publications;
- reaction to the publication (like, comment, repost);
- video, photo, animation, text.
In contact, page statistics are also presented by the social network’s own capabilities. How to open statistics? Just enter the address https://vk.com/stats?gid= and add the group id, and the group statistics in the contact will be opened. But only on condition that the administrator has not blocked access. How can a non-administrator view it? By contacting the administrator as a potential client, you can ask to open your attendance data for review by another person.
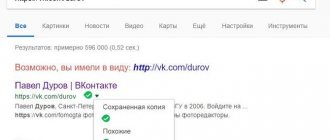
Is it possible to determine how the user got to the page? Yes, according to the “Referral Sources” diagram – through direct links, news, search results. By the way, the “search results” column is conventionally considered an indicator of queries. The most popular queries can be found in the community search. You cannot delete recent requests, so you will have to fill the history with new data. Contact request statistics can also play an important role in choosing the topic of a group and page.
How to view visit statistics in contact? On the group analysis page you can see a lot of data, including the number of unique visits to the page. How to increase statistics in a contact in a group? If the group is interesting and smart steps have been taken to advertise the community, then subscribers will accumulate on their own. There is also a free or paid subscription option. The number of users is what makes the statistics.
In Contact, hashtag statistics are available for viewing only in the Russian Federation. It is located on the news search page. Why is the publication not shown when searching for a hashtag? Probably, the rule on the number of hashtags was not followed - there should be no more than 10.
Uploading VKontakte community statistics
Statistics can be downloaded in xls or csv format and analyzed on a computer. To download VKontakte page statistics, click the “Download statistics” button (in the upper right corner).
A window will open with a choice of parameters:
- Upload format;
- Time interval;
- Type of data to export (community statistics or post statistics);
- Data types.
By default, VKontakte statistics are uploaded by day. To analyze data for a month at once, create a pivot table.
Statistics on records in the upload are more detailed than in the account. Displayed here:
- Date of publication;
- Post author;
- Full text of the entry;
- Link to post;
- Coverage: subscribers, viral, advertising, full;
- Number of likes;
- Number of reposts;
- Number of comments;
- Number of hides;
- Number of complaints;
- The number of hides of all community posts;
- Transitions to the community;
- Community subscriptions;
- Transitions via external links.
How to collect statistics? TOP best services
Let us immediately note that most services for collecting information from VK pages are paid, but you get graphic and understandable results that are used for promotion and advertising.
So, the top 5 best services:
- Popsters will cost at least 400 rubles per month, analyzes any pages, even if you are not an admin, helps identify pros and cons, compares, sorts information, helps identify the most interesting publications.
- SocialStats works for free, tracks popular publications, and analyzes media content. But it does not always work stably and does not analyze competitors.
- LiveDunePro will cost 1,900 rubles, helps you find suitable sites for advertising, you can monitor the activities of competitors, analyzes hashtags, but analytics are not enough.
- JagaJam is suitable for full and in-depth analytics; it breaks information into categories, has daily data updates, and creates a ready-made report on the activities of a community or page.
- AllSocial works free of charge, is ideal for simple analysis and assistance in media planning, has a page rating, collects data on all users, and displays links to the most popular competitors.
Analysis of personal VKontakte page
All users who gain more than 100 subscribers have access to the statistics of their personal VK page. Yes, you can simply unfriend users who raise the question “Who is this anyway?” (We're sure everyone has one of these).
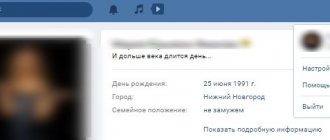
The link to the community page is located under your profile photo.
Statistics for a personal page on VKontakte are similar to group statistics, but in an abbreviated version. There are only three sections here:
- Coverage;
- Attendance;
- Activity.
Similarly with community statistics, you can see the reach of subscribers and the socio-demographic characteristics of your audience, as well as the country and city (from the profile on VKontakte), where they live, and what devices they use to visit the social network.
The “Attendance” tab contains data on subscriptions and unsubscribes to your page. Data can be displayed for a day or for all time. At the same time, by moving the window under the graph, you can change the time interval for which VKontakte statistics are displayed.
On the “Activity” tab, you can evaluate the popularity of your content on VKontakte: the number of likes, comments, reposts and hides.
It also displays the number of users who have turned on notifications about your new posts - this means that they do not want to miss your posts, even if the algorithms do not show them in the news feed.
Personal page statistics can be exported , this works in the same way as exporting community statistics.
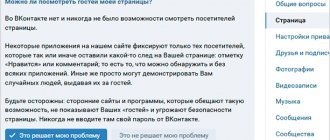
Why are there different IPs in the history of VKontakte activity?
As already noted, when checking the activity of a user’s VK page, you can view information about from which devices and at what time the authorization on the site occurred. Constantly changing IP can have several reasons:
- Logging into your account is carried out by connecting to different networks. This can be mobile Internet, a home Wi-Fi modem, or a network in a public place. It’s worth taking this into account and when checking profile traffic, be guided by time, geographic location and login device.
- The user has a device IP address automatically assigned by the provider (each time he connects to the network). In this case, the address digits can be new each time or alternate periodically.
When checking the entire history of profile activity, the following factors can serve as evidence of hacking: a different city and country is specified (unless, of course, the user used an anonymizer), the login time, the device and browser used do not match.
Statistics of any VKontakte page
We have dealt with analyzing the statistics of our own pages and communities. Now let’s learn how to look at the statistics of other people’s pages: competitors or public pages where you plan to buy advertising.
In order to view statistics of communities and pages on VKontakte, to which you do not have access, use. You will even receive data that is not included in the built-in community statistics.
Let's take a look at the statistics of the Amediateki community together. We entered the address into the search bar and selected the analysis dates: let it be a month, from April 15 to May 15.
A dashboard with 3 columns will open:
Statistics
Here you can select graphs based on different parameters : activity in the community by day of the week and time of day, likes, comments, views, reposts, ER, subscriber growth. And also: the volume of text, the number of publications, the ratio of audience activity and the length of the text and publication formats (photos, videos, text). Read more about each indicator in the FAQ.
Ribbon
This column contains all community publications for the selected period .
Using the example of Amediateka, it can be seen that the most popular post is the announcement of the series “Patrick Melrose” (surely the secret of success is Benedict Cumberbatch!).
By default they are sorted by number of likes , but you can choose any other parameter to analyze competitors on VKontakte. For example, to determine the most engaging topics among your competitors, sort posts by comments.
Name
The third column displays general information: the number of likes, comments, views, reposts for the period, ER (engagement rate). This section is marked with a red arrow in the screenshot above.
There is also a button for downloading all publications from the feed to Excel. Posts are exported along with text, images, and detailed statistics for each post.
When you click on the “Show table” button, a summary for the selected period opens. It is convenient to insert into presentations or show to a client. 
The full analysis result can also be uploaded to XLSX, PPTX or PDF. The download button is located on the left, in the “Statistics” column.
Now you can analyze your competitors’ VKontakte statistics using Excel, if this is more convenient. Or create detailed reports with VK community statistics for your clients in a couple of minutes.
Statistics: what is it, what is it like?
Statistics are the only tool that shows the real interest of users in a page or group. It is also a must-have tool for people who are involved in the promotion and development of communities.
It comes in two types:
- For a personal page;
- For a group or community.
Thanks to this function, you can get a lot of useful and necessary information. For example, how many subscribers follow the page, their geolocation, age, gender, period of activity on the social network, and so on.
I’ll tell you right away that you can’t look at the statistics of someone else’s page. The only way is if the person downloads all the information and sends it to you.
So:
- On VKontakte you can view community statistics: users reached, post statistics, socio-demographic characteristics of the audience, detailed post statistics.
- Access rights can be managed: open it only to community administrators or to everyone (for example, to sell advertising in the community). But only administrators can see record statistics.
- VKontakte personal page statistics are available for users who have more than 100 subscribers.
- Both community statistics and personal page statistics can be downloaded.
- Popsters can analyze other people's VKontakte communities. It displays data about each post and the dynamics of the community, and the report results can be downloaded.
How else can you track the activities of a specific person?
This method is cool because it can be used to collect all activities at once.
As before, we will need a list of communities or users for input.
If this is a list of communities, go to the Activities > Communities . And if we search on the pages of friends (or other people), in the Activities tool > Users .
The only difference between the tools is where we will look for information. Discussion block will be added to it , everything else is identical.
Insert the ready list into the input data window (or select it from the task history).
In my case these are communities:
In the What activities to consider , check the boxes to select what we need and where to look for it.
Authors are those who published their entries on the community wall or on the user page.
Likes - those who liked.
Comments - who wrote comments on the specified block.
Comments > Likes - who liked other people's comments.
Polls > Participation - those who participated in surveys.
checkbox to 1000 . Since without restrictions, too much data is generated to collect, which risks not being processed.