Oleg Ibragimov
I help with choosing services. Extensive experience in marketing and analytics. I work with both clients and agencies. Grew up from being an assistant to a regular SEO specialist...
Share
Share this article with friends and colleagues
For a general understanding of the audience of the VKontakte community and an approximate assessment of the effectiveness of promotion, a built-in statistics system is sufficient. With its help, you will find out the reach, demographic characteristics of subscribers, their geography, viewing data, and so on.
Unfortunately, for truly deep analytics you need to use special tools and services. They will be able to tell you what publications the audience likes, when is the best time to post them, what promotion tools to use, and much more. Today we will look at 10 excellent services for analyzing VKontakte statistics.
Get up to 18% of your expenses on contextual and targeted advertising!
We recommend:
Click.ru – marketplace of advertising platforms:
- More than 2,000 advertising agencies and freelancers are already working with the service and receiving compensation.
- You can connect yourself in 1 day.
- Earn from the first ruble spent, without initial restrictions, without an entry barrier.
- Payments via WebMoney, to a card to an individual, reinvestment in advertising.
- You still have direct access to advertising accounts, a paradise for accounting for document flow and payments.
Go to website
Pur.Ninja
Service for publishing and analytics on social networks. Along with VKontakte, it supports 6 other platforms (Facebook, Instagram, Odnoklassniki and others). With it, you can schedule posts, repost, create polls, attach products or albums to posts, and much more.
With Pur.Ninja you can create scheduled posts with adaptive content for different social networks (preview supported). You can use templates, watermarks, and so on. The analysis function will allow you to learn how to create the right content that maximally engages your audience. Available:
- Quick statistics – dynamics of key indicators (subscribers, likes, comments, reposts, clicks) in the form of graphs;
- Audience analysis – dynamics of audience growth/gain for the selected period;
- Post engagement – analysis of ER publications. Average ER, number of posts per day, as well as Love Rate, Talk Rate and Share Rate are available;
- The best time to post - shows the dependence of social actions (likes, reposts, etc.) on the time of day and day of the week. Data is provided in graph format;
- Post analysis – data on published posts (likes, comments, reposts, clicks) indicating a specific publication and information on it.
There are 4 tariffs available: “SMM”, “Business S”, “Business M” and “Business L”. Depending on the tariff, the available number of connected pages (from 10 to 100), RSS posts per day (from 250 to 1000) and the number of connected managers (up to 15) differs. The functions (with the exception of teamwork on the “SMM” tariff) are completely open on any tariff. To analyze your VKontakte community, you can use the cheapest tariff. Test period – 7 days.
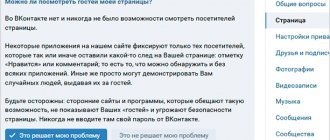
How to view VKontakte community statistics
There are two convenient ways to view page statistics:
- Built-in VKontakte statistics (your own accounts);
- Using an analytics service on social networks (your own and other people’s pages).
VKontakte pages and groups have the same statistics, so let’s agree - we’ll tell you about everything at once.
The simplest numbers can be obtained directly on the community page: the number of views, likes, comments, reposts of publications, the number of subscribers. This data is visible to all users.
For more detailed statistics, go to the "Community Management - Statistics" section.
By default, detailed VK statistics are available only to administrators, but they can be opened to everyone. This function is used by public owners who sell advertising: open statistics prove that posting in the community will be effective.
To change access to community statistics, scroll to the bottom of the statistics page, where the “Who can access community statistics” block is located there.
Here you will see sections:
- Coverage;
- Attendance;
- Activity;
- Community messages;
- Records.
The “Reach” and “Attendance” sections contain graphs that can be displayed by day, week or month and select the desired time interval.
Below is information about the audience in question:
- Gender/Age;
- Geography;
- Devices (mobile/computers).
The “Activity” section displays information about user actions:
- Subscribe to notifications about new posts in the community.
- Engagement indicators: Likes; Comments; Reposts; Hiding community posts from the feed;
- Activity in photo albums;
- Participation in discussions.
The “Community Messages” section collects information about correspondence with the page. Even if you don't have the Community Posts widget connected, you can still see information about user requests to yours on your community page.
There are two graphs available here:
- Unique users who sent messages;
- Number of messages sent and received.
Post statistics are available for communities with more than 5,000 members. By default, this data is not collected. When you first enter this section, click on the “Enable advanced statistics” button.
Unlike other statistics sections on VKontakte, detailed post statistics are visible only to administrators and editors, even if in the settings you have opened the statistics to everyone.
The “Posts” section displays data about each community post. On the site you can see statistics about the last 150 publications, and in the download - about 300.
When you delete a post, its statistics also disappear.
In the "Posts" section you will see:
- Total reach and subscriber reach;
- Likes;
- Reposts;
- Comments.
In the hiding tab: Number of times the entry has been hidden. Complaints. Hiding all entries.
In the transitions tab: The number of people who transferred to the community, joined the community and clicked on the link. Number of introductions from this entry. Number of clicks on the link.
Data is updated every 10 minutes.
LiveDune
Service for comprehensive work in social networks. With its help, you will analyze audience growth and coverage, and you will also be able to increase engagement and sales with minimal labor costs. The service supports VKontakte and 5 other platforms (Instagram, YouTube, Odnoklassniki and others).
LiveDune monitors comments, allows you to make delayed publications, generates reports, checks bloggers for cheating, and much more. To analyze a VKontakte page, the following is available:
- Subscriber statistics – dynamics of subscriptions and unsubscribes over a period of time, average values, maximum/minimum changes;
- Content analysis - assessing the quality of posts by the speed of gaining likes, the number of likes, comments, ER, ERR, etc. To find out what content subscribers prefer, you can use additional metrics: “Publication length”, “Post type” and “Post categories” ;
- Engagement analysis – assessment of the active share of subscribers. The system calculates the classic ER and ERReach. You will also see how much higher/lower your ER is than that of similar accounts. The graph shows the dynamics of the indicator;
- Analysis of promotional posts – analysis of total reach/likes on publications, divided into organic and advertising;
- Audience analysis – data on subscribers: countries and cities, socio-demographic criteria. The data is displayed on graphs and can be downloaded to Excel.
There are 3 tariffs available: “Blogger”, “Business” and “Agency”. Depending on the tariff, the connected number of accounts (from 1 to 300), employees (from 1 to 5), the maximum period for displaying data (from 1 to 5 years) and functionality differs.
Detailed statistics are available on the cheapest tariff; to quickly collect statistics, you will need to connect to the “Business” tariff. Trial period – 7 days.
Analysis of personal VKontakte page
All users who gain more than 100 subscribers have access to the statistics of their personal VK page. Yes, you can simply unfriend users who raise the question “Who is this anyway?” (We're sure everyone has one of these).
The link to the community page is located under your profile photo.
Statistics for a personal page on VKontakte are similar to group statistics, but in an abbreviated version. There are only three sections here:
- Coverage;
- Attendance;
- Activity.
Similarly with community statistics, you can see the reach of subscribers and the socio-demographic characteristics of your audience, as well as the country and city (from the profile on VKontakte), where they live, and what devices they use to visit the social network.
The “Attendance” tab contains data on subscriptions and unsubscribes to your page. Data can be displayed for a day or for all time. At the same time, by moving the window under the graph, you can change the time interval for which VKontakte statistics are displayed.
On the “Activity” tab, you can evaluate the popularity of your content on VKontakte: the number of likes, comments, reposts and hides.
It also displays the number of users who have turned on notifications about your new posts - this means that they do not want to miss your posts, even if the algorithms do not show them in the news feed.
Personal page statistics can be exported , this works in the same way as exporting community statistics.
Amplifier
Service for auto-posting on social networks and analytics. Works with VKontakte and other platforms (Facebook, Instagram and others). Includes scheduled posting, collaboration on social networks and a post editor.
With the help of Amplifier you can evaluate the quality of your VKontakte community. The service generates visual analytics on publications, time and sends reports by e-mail. You can analyze the content of pages over the last 30 days. The assessment of SMM strategies can be seen in 3 diagrams. You will find out the coverage of publications, traffic, engagement (by subscribers and reach) and interactions.
The amplifier shows which posts the audience likes most. You can also analyze your closest competitors and compare their statistics with yours.
There are 4 tariffs available: “S”, “M”, “L” and “XL”. Depending on the tariff, the number of connected pages (from 5 to 100), jobs (from 1 to 10), projects (from 1 to 10), as well as functionality differs. With the cheapest plan, you can use basic analytics - it does not include metrics on reach, best time to publish, subscriber and ER dynamics, or reports in Excel. To access full analytics, you will need to connect to the “M” tariff.
MEDIA-VK.RU
A very simple service that can analyze your and other people’s communities.
By indicating the community address and your email on the website, you will receive a letter with a link to the finished report. In the report you can see data on the distribution of participants by gender, age, geography and marital status. The service also shows the TOP 30 communities in which the participants of the analyzed community are members.
Well, perhaps the most interesting thing is the profile of a typical subscriber. Based on the analyzed data, the service describes the gender, age, geography, marital status and communities of which the “typical subscriber” is a member.
Report data can be downloaded in XLSX or CSV format.
When replenishing your account, the service offers as many as 7 tariffs to choose from, depending on the sample you want to analyze.
Payment can be made through Yandex.Money, WebMoney or the Robokassa service. For legal entities, payment by bank transfer is possible by prior arrangement.
Email or the official community on VKontakte are used as a communication channel with developers. There is no mobile version.
Pros:
Very simple interface and detailed instructions for use. Also interesting is the section “Example of analysis based on a report” - here is material in which, using a specific example, it is described how to interpret the data received - after reading, even a person far from SMM will be able to use the service for good.
Minuses:
Not enough data in the report. Not very convenient pricing, which depends on the number of participants in the sample. The maximum number is 30,000 people.
JagaJam
Service for analyzing communities in social networks. Supports VKontakte and other platforms, including Instagram and YouTube. With its help, you can not only track post statistics, but also control promotion costs and learn about your competitors.
JagaJam includes 2 tools:
- JagaJam Suite;
- JagaJam Analytics.
JagaJam Suite is suitable for assessing the effectiveness of content: you can learn how to make it better. The tool can be used to simultaneously work on 6 social networks (including VKontakte). Suite displays data on a single graph, so you can see the dependence of metrics on the content of publications. A neural network is used to evaluate the effectiveness of content - it determines the relevance of the publication and suggests development strategies. For analysis, you can use data for the entire existence of the community, compare different periods, export data to Excel, etc.
JagaJam Analytics offers more powerful features for analyzing communities: you can track subscriber reactions to content, identify effective posts, and evaluate audience preferences and trends.
The tool shows organic and paid reach, engagement, link clicks, etc. Analyzing the sentiment of posts will help build communication with subscribers. The system monitors suspicious activity and prevents critical situations.
There are 2 tariffs available for Suite: Demo (for 14 days) and Basic (works with 6 social networks). Suite is suitable for analyzing posts, grading and assessing the effectiveness of content types. If you are interested in analyzing comments, data on internal statistics and advertising account, and determining the best time to publish, then you will have to use JagaJam Analytics.
JAGAJAM.COM
A service that has been successfully developing for a long time and is very popular in the smm market.
The interface is intuitive, all indicators are equipped with tooltips, there is even its own JagaJam.Wiki with articles explaining all aspects of the service.
Before collecting data, you must set a reporting period (by default this is the last month).
The first tab of the service contains data on the main indicators and their dynamics: the number of participants, the amount of content posted in the community, the number of all user actions, average user activity per day and the engagement rate.
The service builds separate graphs based on the dynamics of the number of participants in your community, their actions and involvement, as well as the amount of content posted per day (not only posts are taken into account here, but also photo albums, videos, etc.)
The second tab is “Audience”. Here the service provides data on the main parameters and their dynamics. This includes: the number of participants, active participants for the week and month, activity in relation to the community as a whole, and activity that users showed in relation to the content specifically.
You can also see data on active audience cores - starting from those who reacted to community content at least once, and ending with those who did this at least 10 times. The most meticulous ones can find out the shares of each next core in the previous one, as well as see the numbers for existing and dropped out participants who reacted or did not react to the content.
Also in this tab you can find the number of people who joined and left the community and useful data on the gender, age and geography of users over time.
The next tab is “User Lists”. This is a rating of all users who have ever performed actions in the community - posted, liked, commented or reposted.
"Content" tab. The main parameters are the number and dynamics of posts, photo albums, photographs, video albums, videos, discussions. You can also compare the popularity of posts, photos, and so on.
The Popular Content tab displays the ranking of your posts based on their popularity level. Various filters and sorting types are available.
The “Activity” tab makes it possible to analyze the diversity of user reactions to content. The same data is presented in the form of indices and their dynamics in the “Involvement” tab.
Additionally, you can compare pairs of communities and analyze intersections.
Uploading reports is available in XLSX format. You can customize templates yourself, as well as create a schedule according to which reports will be automatically sent by email.
The service offers you to choose one of 4 tariffs. Payment is accepted through the PayOnline service or by bank transfer (for legal entities).
Email or service communities are used as a communication channel with technical support. The site does not have a mobile version.
Pros:
Statistics are collected on a huge number of parameters. The service is convenient for legal entities. There is detailed help on all sorts of questions.
Minuses:
High price. The comparison and intersection functionality is only available for pairs of communities. You can delete and replace the analyzed community with another one only after 7 days.
Popsters
A service for analyzing publications and competitors’ pages on social networks. Supports VKontakte and other platforms (Twitter, Pinterest, Odnoklassniki). The tool can analyze publications on any pages of interest - you don’t need to be an administrator to find out information about the community.
Possibilities:
- Analysis of the popularity of publications - the service shows which posts attract subscribers, provides data in terms of formats, text volume, date of publication, subject of publication.
- Performance analysis is an assessment of the total and average performance of publications over different times, with different hashtags. Statistics and dynamics.
- Page comparison – simultaneous analysis of several pages, analysis of communities from different social networks, batch downloading.
- Reports – uploading information in popular formats (PDF, XLS, CSV).
When using Popsters for a fee, there is a limit of 1 workplace and 1 social network, and there are no restrictions on the number of downloads and the volume of favorites. To test the service, you can use a free 7-day trial period (10 trial downloads).
Publer
Service for analyzing pages on social networks. With its help, you can analyze your competitors, their creatives, find the most profitable deals and launch effective advertising. Data is collected from 900 thousand communities, 300 million posts and 8 million advertisements.
To analyze communities and profiles on VKontakte, Publer can:
- Display the main parameters of the community (number of bots, CPM, ER, and so on).
- Build graphs of subscriber activity (days, hours, days of the week, etc.) to determine the time of the most effective publications.
- Display the dynamics of the release of posts (advertising posts) and analyze advertising in a community or profile.
- Build comparative tables of communities by activity and other parameters.
- Display subscriber dynamics for a certain period in the form of a graph/table and much more.
The free plan allows you to use the basic functions of Publer and analyze competitors' advertising. The premium tariff provides access to in-depth analysis of VKontakte communities, quick analysis of social networks and advertising, data export to Excel and other service features.
Uploading VKontakte community statistics
Statistics can be downloaded in xls or csv format and analyzed on a computer. To download VKontakte page statistics, click the “Download statistics” button (in the upper right corner).
A window will open with a choice of parameters:
- Upload format;
- Time interval;
- Type of data to export (community statistics or post statistics);
- Data types.
By default, VKontakte statistics are uploaded by day. To analyze data for a month at once, create a pivot table.
Statistics on records in the upload are more detailed than in the account. Displayed here:
- Date of publication;
- Post author;
- Full text of the entry;
- Link to post;
- Coverage: subscribers, viral, advertising, full;
- Number of likes;
- Number of reposts;
- Number of comments;
- Number of hides;
- Number of complaints;
- The number of hides of all community posts;
- Transitions to the community;
- Community subscriptions;
- Transitions via external links.
Borgi.ru
Service for analyzing communities and advertising on VKontakte. With its help, community administrators will be able to monitor their groups and competitors' communities. You can also track market trends, look for new offers, select high-quality communities for advertising, and so on.
Borgi collects complete statistics on VKontakte communities: you can see the total number of posts on community walls, frequency of publications and subscriber engagement. The service shows data on the audience - total number, number of blocked or deleted users and inactive audience. You can also get acquainted with detailed page statistics: visits by men and women, coverage of posts from mobile devices and computers, the share of subscribers under 18 years of age, as well as the distribution of visits from different countries.
AllSocial
Website:
allsocial.ru
Price:
For free
Demo period:
No
Free plan:
Yes
The rating is formed from open community data
A small free service for analyzing communities for advertising. Suitable for planning an advertising campaign on a specific topic if you do not have the opportunity to use a paid parser.
- There is a general rating of pages, there are separate ratings for public pages and groups;
- Collects data on reach and number of visitors;
- Forms CPP - the amount that will have to be spent on advertising with a coverage of 1% of the total number of community subscribers.
Only official company communities can be selected
Peculiarities:
- Completely free;
- Shows in the table a list of links to popular community administrators - you can select the ones you need and immediately write in private messages;
- There is a distribution of communities by category;
- You can select official communities.
There is a list of the most popular community moderators with an active link to dialogue with them
CleverPub.ru
A service for managing VKontakte communities and analyzing their development. Includes accurate auto-posting with the ability to repost, tracking advertising channels, searching for messages and communities by parameters.
Through CleverPub you can track the dynamics of community development and choose the most optimal promotion methods, as well as evaluate the statistics of other communities. You will be able to get acquainted with unique views and visitors, gender and age characteristics of subscribers, information about potential members, coverage, feedback (likes, reposts, comments), virality and audience intersections.
The service offers 3 tariff scales – “Autopost”, “Message Search” and “All Inclusive”. To analyze communities, you need an “All Inclusive” tariff, which opens up all the capabilities of the service.
SOCIALSTATS.RU
A free service that nevertheless analyzes a huge amount of data based on many parameters. For a fee, the developer is ready to provide almost any statistics.
The service only works with communities that you manage. Unfortunately, it will not be possible to analyze strangers.
Main sections of the service:
- Community wall statistics. All posts are scanned, as well as comments, likes and reposts. In statistics, you can see data on active audience cores - this includes people who have performed any actions on your wall.
The service also displays the value of various metrics - from standard ER to exotic ones, such as ER according to SocialBakers or Active Core Activity.
- Photo album statistics. The service ranks photos based on the number of likes and comments. Statistics on albums, authors, number of uploaded photos and user reactions are presented separately.
- Video recording statistics. Analysis of video views and data on users who download these videos. Ratings based on the number of likes and comments are attached.
- Statistics on the communities your subscribers belong to. Useful for better understanding their interests and finding advertising platforms. The data is generated in the form of a rating.
- Popularity of pages. The service sorts the pages that your subscribers are interested in by popularity indicators and gives TOP-1, TOP-5 and integral ratings by points.
- Statistics of participants' friends. The service analyzes the friends of your subscribers. The final rating of users depends on how many of their friends are also in your community.
- Geography of subscribers. The data is compiled in the form of a ranking by country and city.
- General community statistics. Ratings of participants, posts, photos and videos based on the number of likes, comments and reposts collected.
As already mentioned, the service is free, so the interface looks harsh and without any frills, and in some places there are advertisements. If you wish, you can thank the developers financially - Visa, Mastercard and Yandex.Money cards are accepted for payment.
The VKontakte community is used as a communication channel with technical support. You can also write to the developer personally. The service does not have a mobile version.
Pros:
Very detailed statistics, a huge number of settings and parameters. In addition to communities, you can analyze personal accounts. If you wish, you can ask the developer to do something individually for you. And, of course, a freebie.
Minuses:
You cannot collect data from other people's communities. At times, the service takes quite a long time to calculate statistics. Sometimes it displays a message about the server being busy. But considering that they don’t require money from the user, it’s awkward to call this a disadvantage.
SocStat.ru
Service for analyzing VKontakte communities. Allows you to get acquainted with the dynamics of subscribers, the degree of involvement, traffic statistics, and so on. With its help, you can analyze the most engaging content, find out what subscribers of other communities on similar topics like, and much more.
Possibilities:
- Community analysis – assessment of statistical metrics: visits, dynamics, content data, engagement. The service shows subscriber coverage, total coverage, user activity and other information about the community.
- Analysis of publications - search for the best publications with filtering by likes, reposts, comments and engagement.
- Audience comparison - finding intersections between several communities. Data is processed quickly even for large communities.
- Searching for “dead” subscribers – creating a list of blocked users, deleted pages, and so on.
To test SocStat, you can use a trial period of 3 days. There are no restrictions.
What to do if group statistics are closed?
As a rule, admins who sell advertising do not hide statistics. If they do this, then perhaps there are some problems in the group, and the cost of advertising in it will be inflated. However, there are situations when the owner of a public site simply does not set out to make money from it, but develops it. The statistics of such communities are simply not made publicly available because there is no need for it. If you find a similar group with high-quality content and good activity, you should offer cooperation to the administrator and ask to open a section with statistics.
Public sites that are not cluttered with advertising are very rare and lucky, don’t miss it.
By the way, if the section with the statue is closed, you can read it based on indirect signs. For example, you can go to the search section for subscribers and there set filtering parameters by geo, gender, age, etc.
Another way to evaluate the effectiveness of future advertising is to look at the reach of posts that the community publishes and calculate the average reach over the past days. You can also roughly see how active the public’s audience is by looking at likes, reposts and comments.
KUKU.IO
A service for planning publications, creating a content plan and analyzing social networks. Works with VKontakte and 9 other platforms, including Facebook, Instagram, Odnoklassniki and others. Social media analytics can filter results across all team members - see how effective an individual team member or the entire team was.
KUKU.IO shows all companies, you can track subscriber growth, clicks, engagement, and analyze the content plan. To analyze publications, clicks, likes, reposts, etc. are tracked. You can compare different publications with each other and filter out the most effective ones.
Analytics graphs show engagement, audience growth, best time to post, optimal posting frequency, page coverage, content analytics by category, and much more.
You can use the service at 4 tariffs: “Individual”, “Advanced”, “Professional” and “Business”. The differences between them are the maximum number of social media accounts used (from 5 to 300), the number of users (from 1 to 25) and posts (from 500 to unlimited). The tariff also affects the available functions. To use all the analytics features, you will need at least a “Professional” tariff.
Did you like the article? 0 0
VKontakte statistics indicators
Let's start, as always, with the basics.
This information applies not only to your personal page, but also to data viewed in groups and communities. 1. Impressions are the total number of views of a particular material. All impressions are counted, even if they were made by only one person.
2. Reach - the number of unique users who viewed the post you published. This indicator is divided into 4 types:
- Full coverage - the total number of unique visitors to VKontakte (the totality of the types listed below).
- Subscriber reach is the number of people in the group who watched the post.
- Viral reach is the number of visitors not subscribed to the community who viewed the publication. Most often they come through reposts on friends’ pages or materials sent in private messages.
- Advertising reach - people who reached the post through advertising on a social network or from third-party sites.